eupnea ︎
project
eupnea, a simple mobile interface for quick checkings on forecasting air quality, as well as to plan for daily activites to protect your health.
brief
The app should access reliable measurement of metrics like AQI and show the pollution level to users. It should have a map integration to show pollution levels based on users’ current location, and would be able to search for other cities to get pollution data as well. The app should offer recommendations for handling a polluted environment, e.g., what type of mask to wear, etc.
project completion
fall 2021
tools
adobe XD
fonts used
fogsta
sf pro display - light, regular, medium, bold, heavy
colors applied ︎ #5275FA / RGB: 82 117 250 / CYMK: 72% 58% 0% 0%
︎ #A0AEFF / RGB: 160 174 255 / CYMK: 34% 28% 0% 0%
︎ #E66950 / RGB: 230 105 80 / CYMK: 5% 73% 72% 0%
︎ #F7B16C / RGB: 247 177 108 / CYMK: 1% 35% 64% 0%
︎ #41B74F / RGB: 65 183 79 / CYMK: 73% 0% 96% 0%︎ #FAEF5E/ RGB: 250 239 94 / CYMK: 5% 0% 76% 0%
let me introduce you to

The air you breathe every day is more toxic than ever as pollution levels continue to rise across the globe.
Whether you're going out for a run or leaving for work, it's wise to keep tabs on your neighborhood's air quality so you can take precautions for your future wellbeing.

Developing a Pollution App
Web and mobile apps are customer-facing tools, also known as “Systems of Engagement” (SoEs). All of the air quality information you want, in one place. Welcome to the first and only app to provide real-time and forecast air pollution and weather data for more than 10,000 cities around the world.

How to formulate a development approach
To launch an app, the design needed an effective development approach.- Use “Application Programming Interfaces” (APIs) and “Software Development Kits” (SDKs) to implement core features.
- Storing a pollution data, map integration, push notification, online payment, and in-app purchase.
- Design and develop in a way so that users can easily launch your app in other geographies in the future.


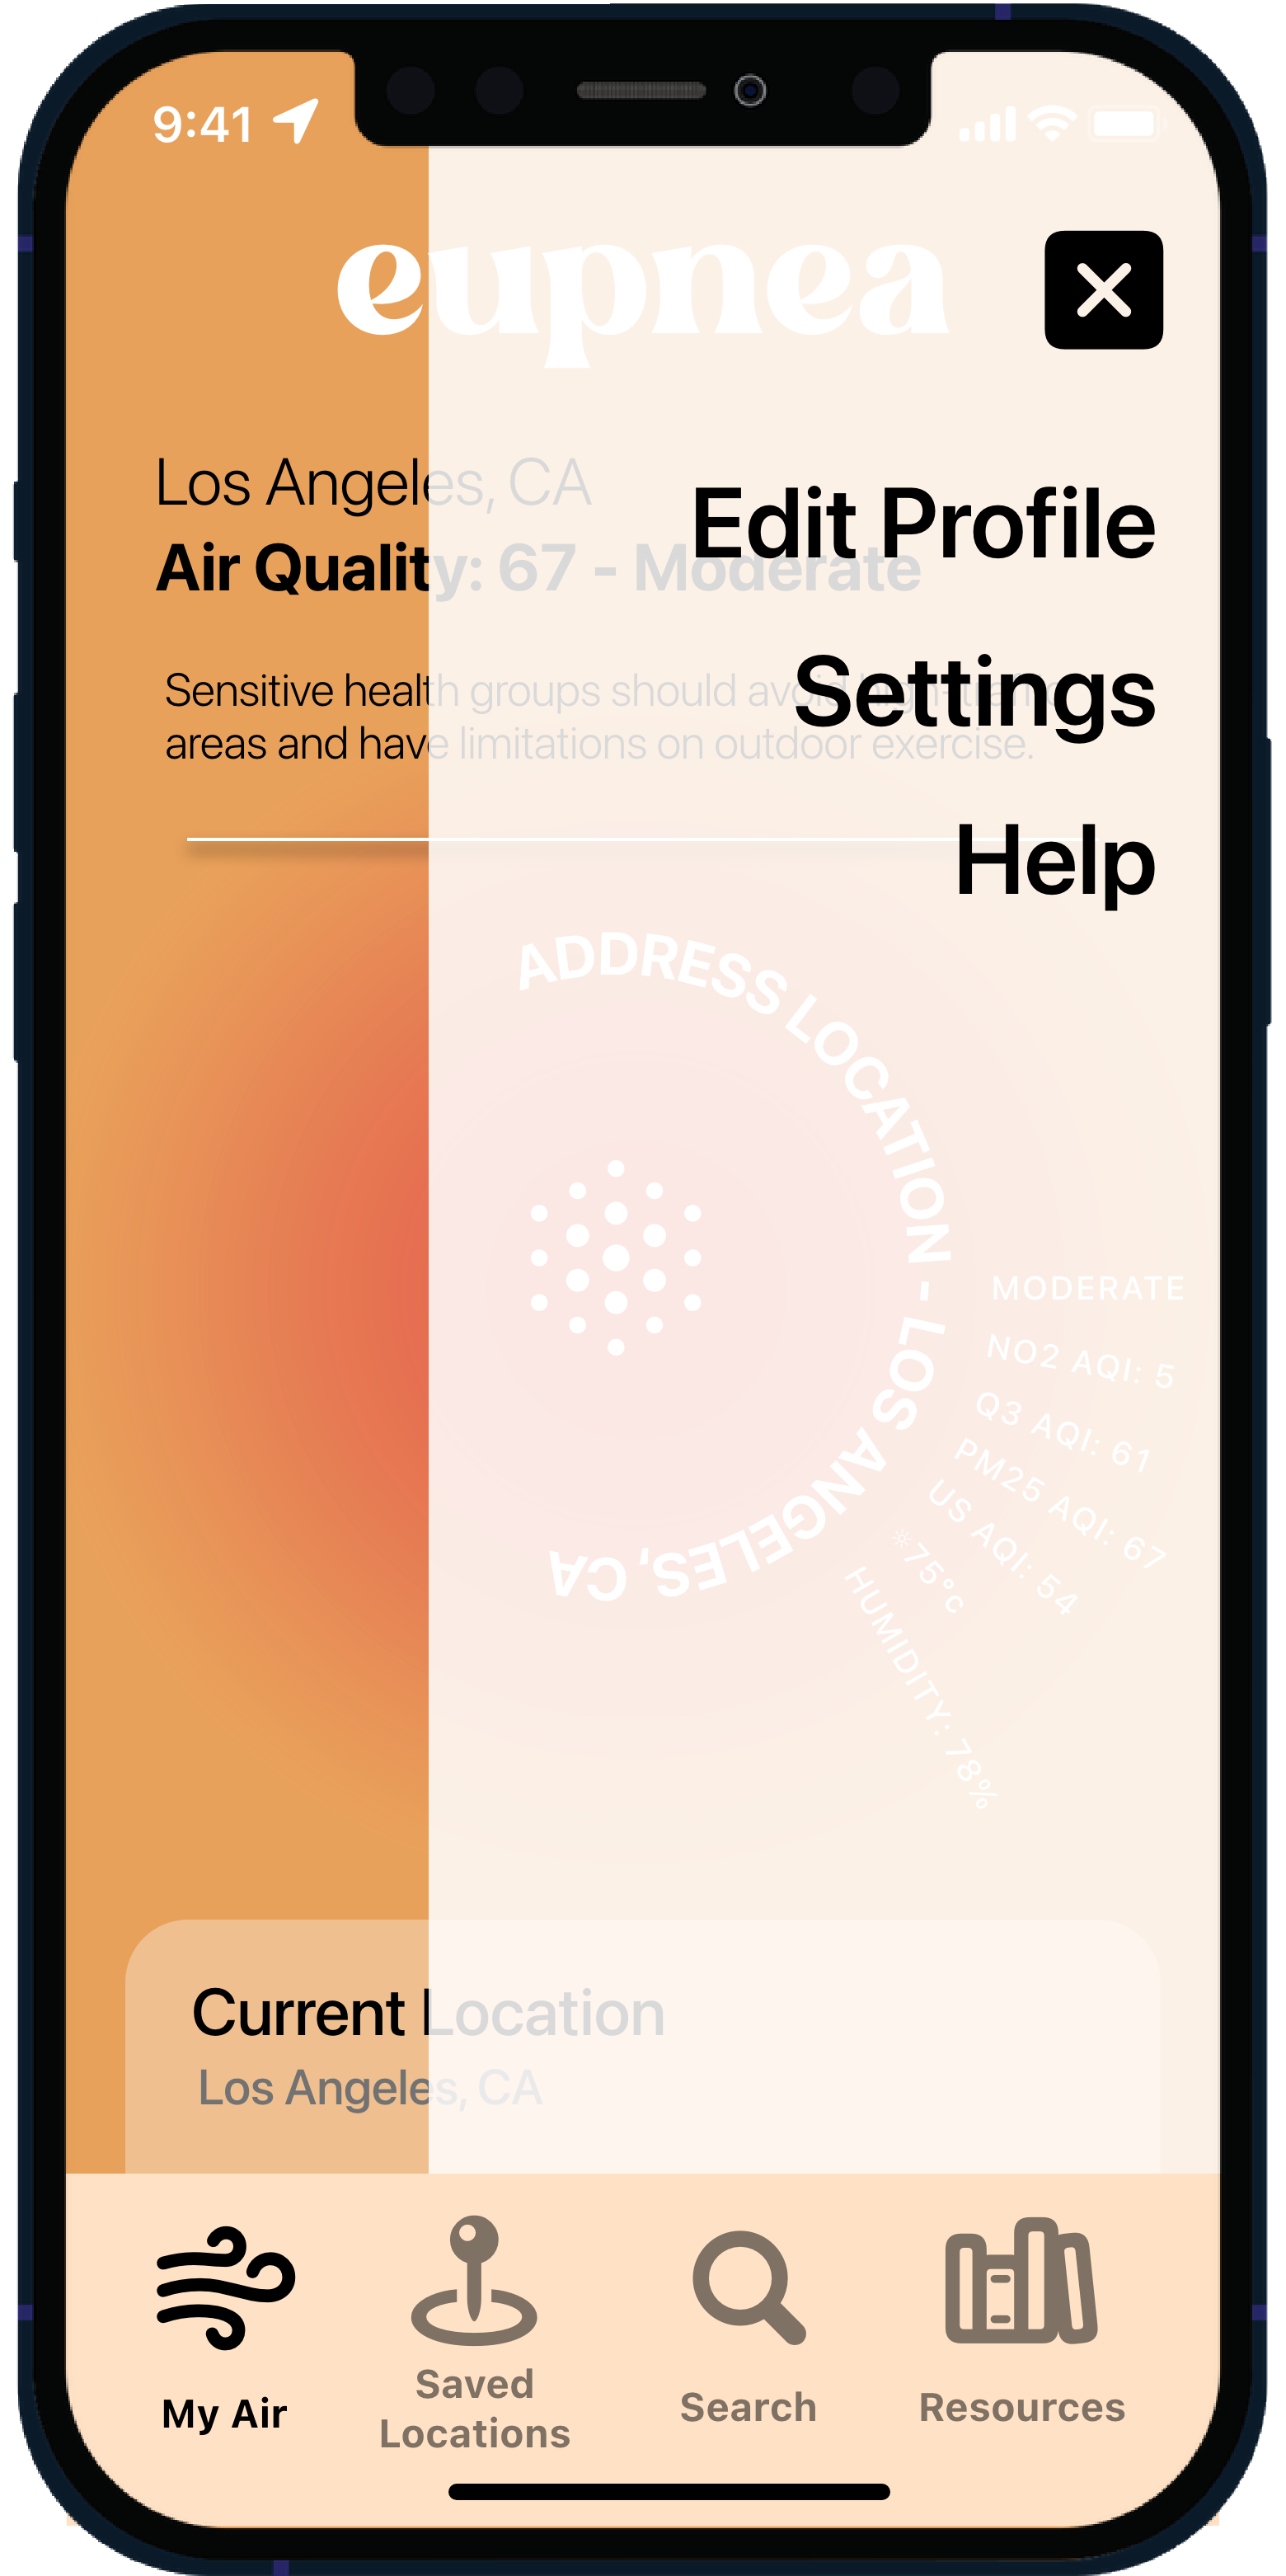
home page
Users are first introduced with the AQI based on their specific location. The home page also informs the user how concentrated the pollutants are, and what kind of pollutants are in the air.
Since there's a time factor involved, AQI is typically grouped into ranges. Each of those ranges is assigned a descriptor, color code, and standardized public health advisory like Poor, Unhealthy, and others.
The use of color indicates how critical the air quality is during that time and location. Warm tones indicate harmful pollutants and low quality, while a cool tone palette indicates a clear, clean breathable quality.

search


save your favorite places
Allows for you to save locations, giving you quick and easy access for checking the locations that matter to you. This also reveals further details such as particle concentration, the best day of the year for air quality, and more. 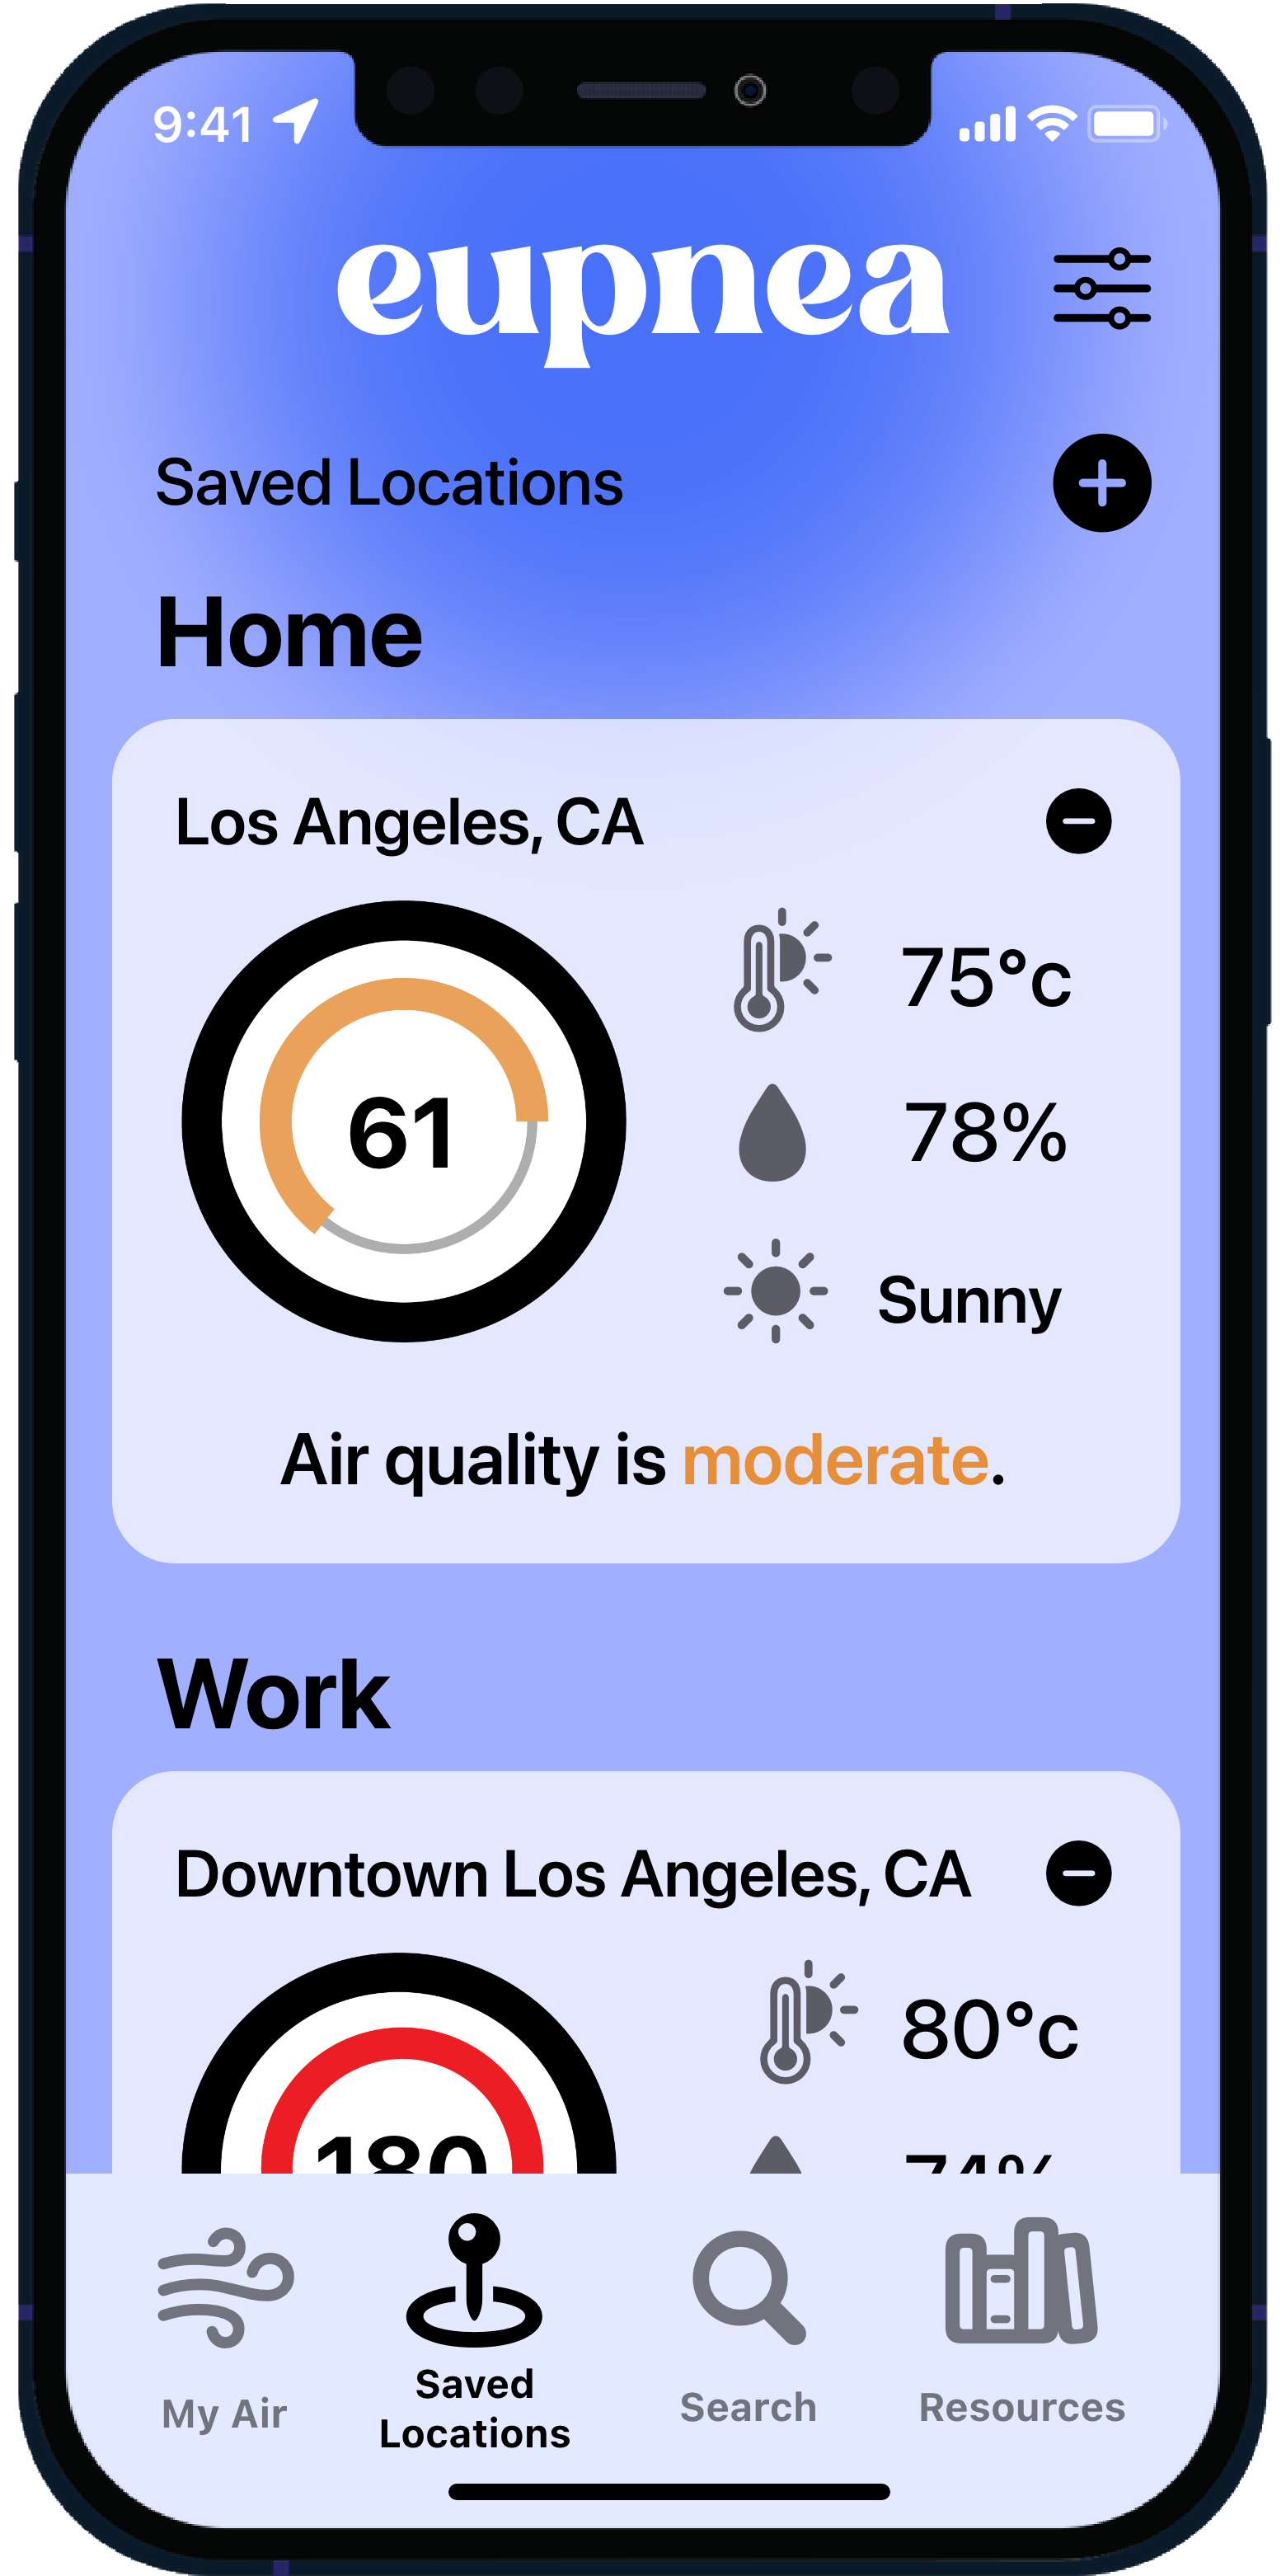

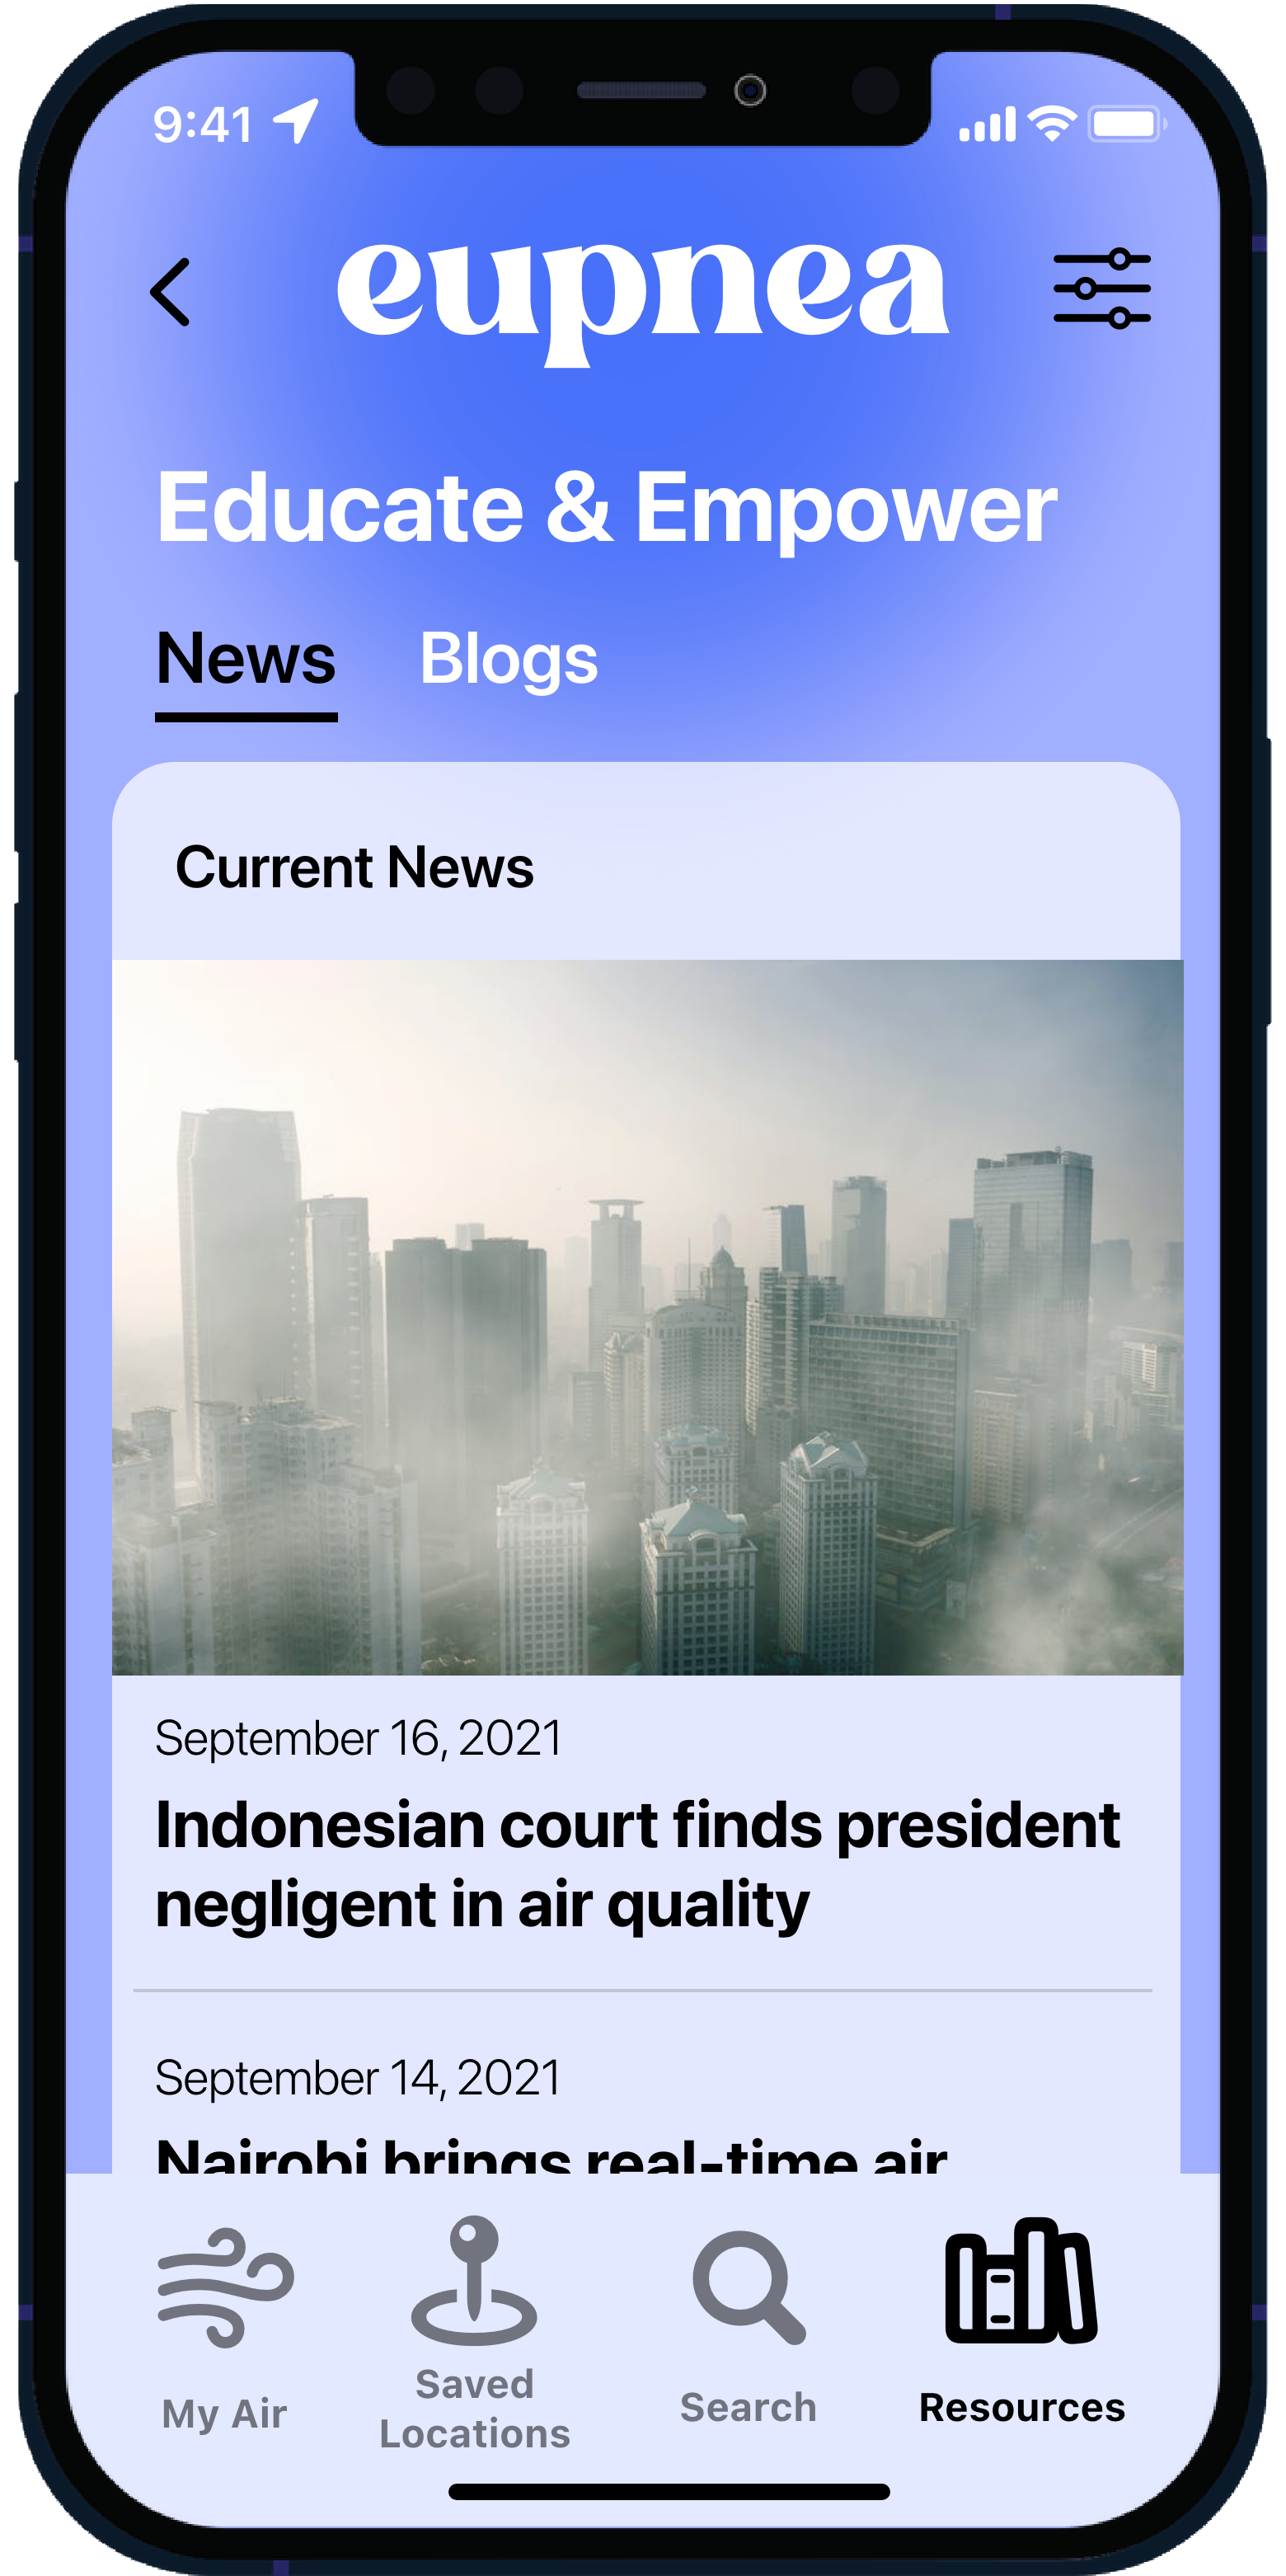
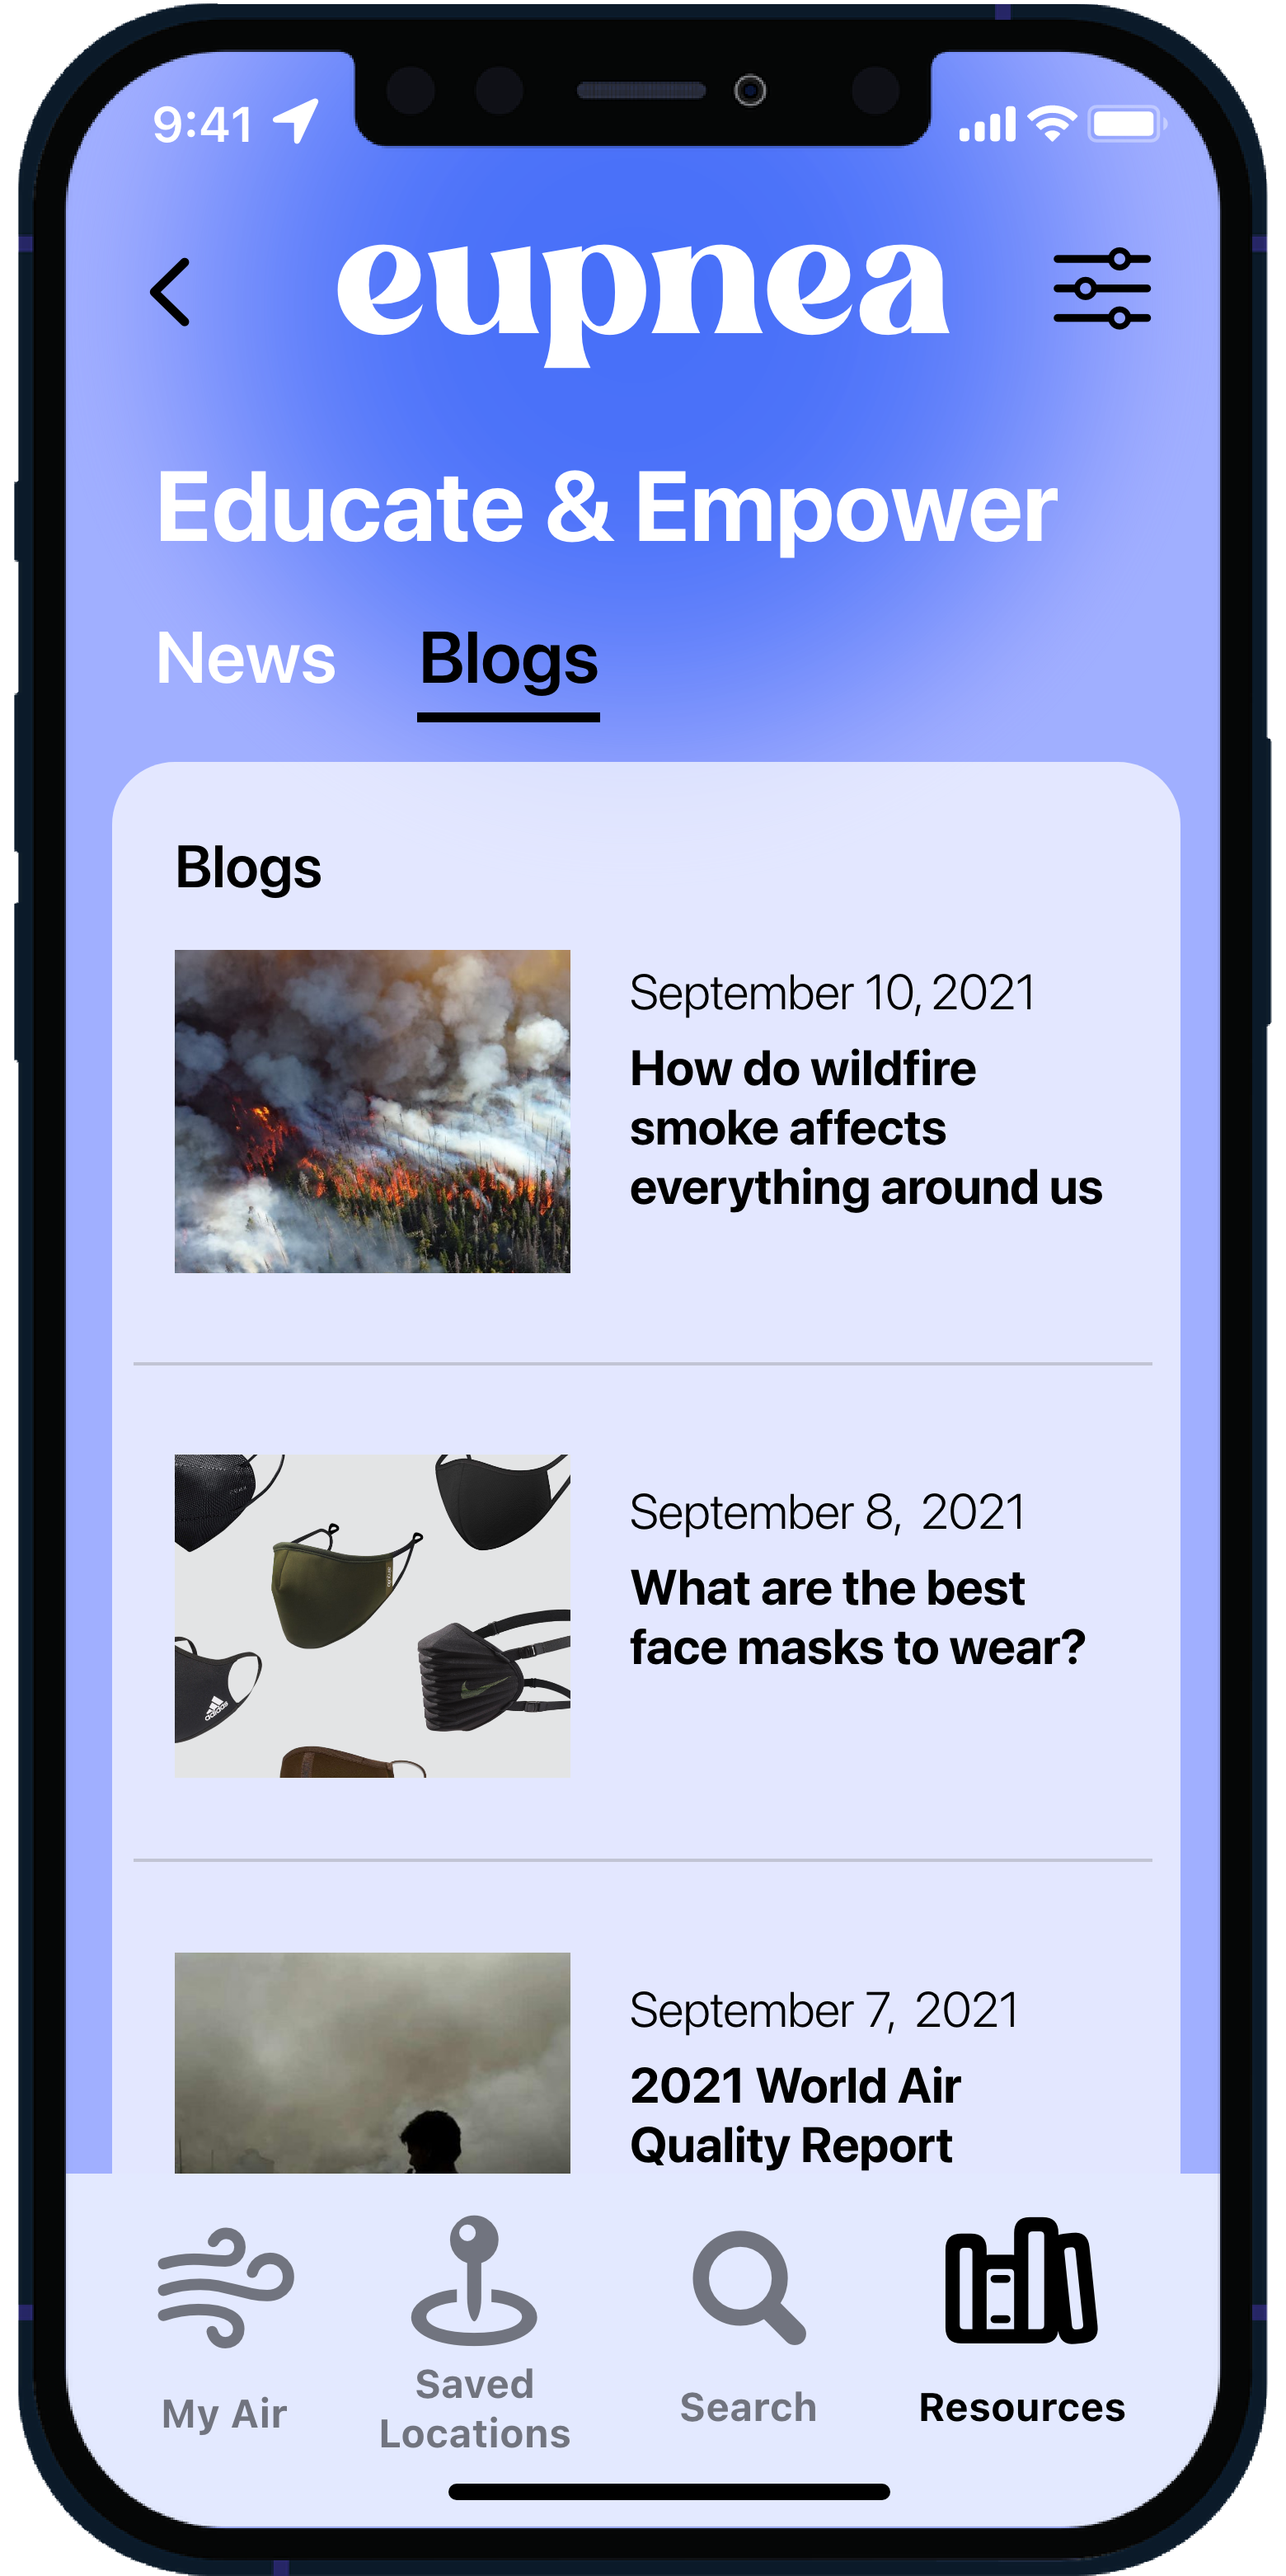
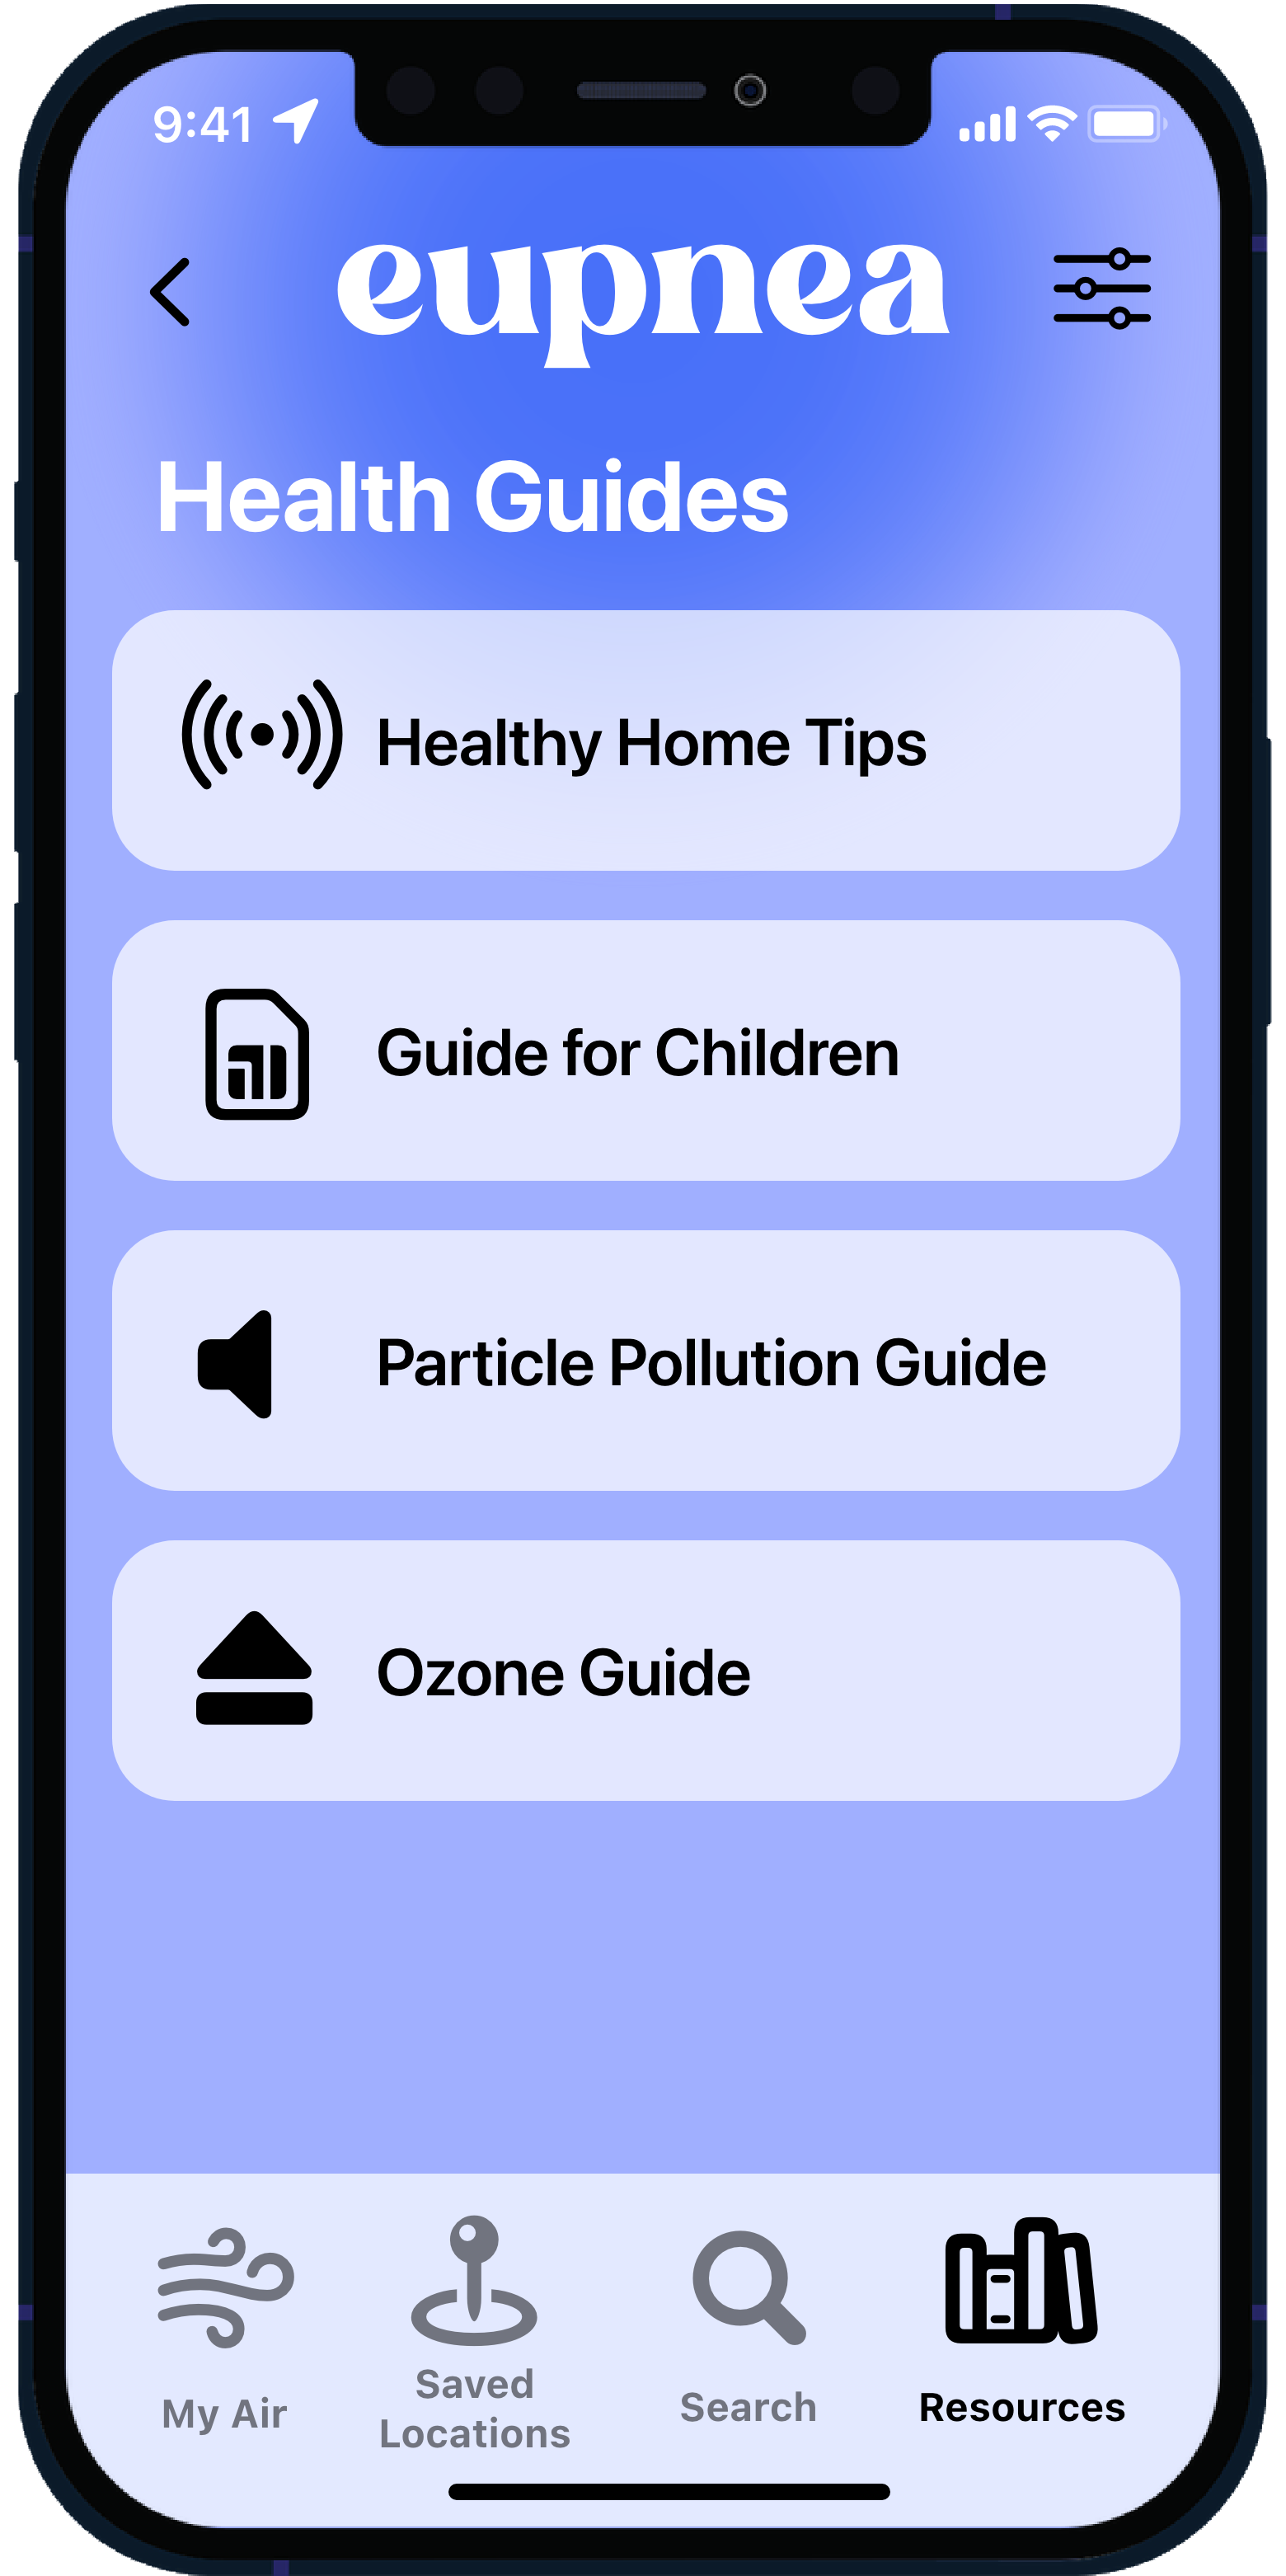
we can advise our users and provide resources on healthy living ideas.
Some info could include health recommendations, through which the app shows steps you can take to avoid getting sick. These include wearing a mask, closing your windows, or avoiding cycling.


understanding user settings